The S&P 500 has long been viewed as the ultimate long-term wealth builder — a benchmark that outpaces most asset classes over time. Yet even the strongest bull markets are not immune to cycles of exhaustion and correction. Today, the warning signs are flashing again, as structural risks begin to mount beneath the surface.
In Q3 2025, despite maintaining its long-term uptrend, the S&P 500 is showing clear cracks in momentum. October’s volatile sell-offs exposed a market increasingly sensitive to negative headlines — from escalating trade tensions and a prolonged U.S. government shutdown, to renewed uncertainty over the Federal Reserve’s policy stance. Together, these factors signal one thing: market optimism remains fragile.
For traders and investors alike, the question is no longer if the S&P 500 will face meaningful pressure — but when it will start to unravel.
Macro Headwinds – Growth Slowdown Takes Hold
U.S. economic growth is becoming one of the most critical watchpoints for investors. Beneath the surface of resilient headline data, momentum is fading, and the signs of a late-cycle slowdown are increasingly clear:
· Labor Market Softening: Between May and August, U.S. nonfarm payroll growth averaged below 50K per month — far under the post-pandemic trend. Meanwhile, unemployment has edged higher toward 4.3–4.4%, the highest since the easing cycle began.
· PMI Contraction: Multiple PMI readings are now dipping below the 50 threshold, signaling contraction across both manufacturing and services.
· Uneven GDP Growth: While GDP prints remain positive, volatility in quarterly growth underscores the economy’s fragile footing.
In short, while the surface narrative still reflects stability, beneath lies a decelerating economy. The late-cycle fatigue is building — and the labor market remains the most concerning weak spot for forward momentum.
AI Overvaluation – The Fragile Core of the Bull
Beyond macro headwinds, the S&P 500’s strength has become dangerously concentrated in a handful of AI-driven mega-cap names. This optimism, once a tailwind, may now be its biggest vulnerability.
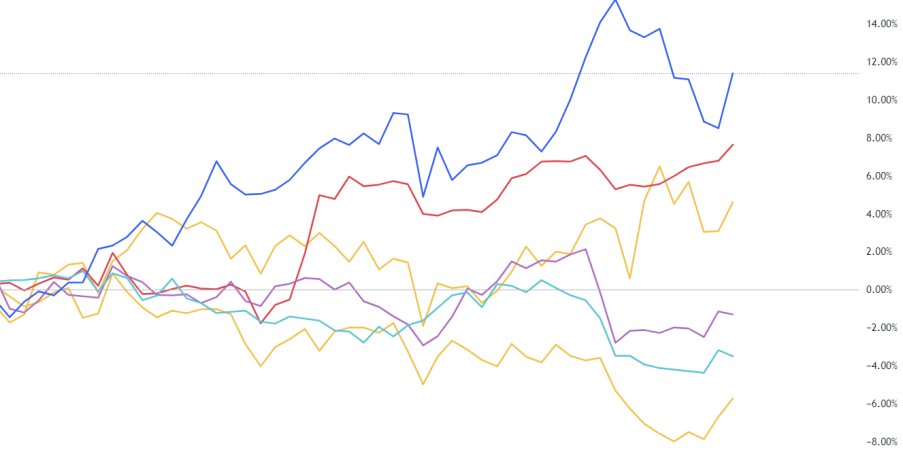
A sectoral breakdown of the S&P 500 reveals that the index’s advance is almost entirely powered by Technology (blue line) and Consumer Discretionary (red line) — the latter heavily influenced by Amazon, another AI-fueled beneficiary. In contrast, key cyclical sectors like Financials, Industrials, and Real Estate are lagging, showing clear signs of deceleration.
This divergence paints a clear picture of a fragile prosperity propped up by a single narrative.
If AI earnings disappoint or adoption slows, the market could face a sharp rotation out of overvalued tech stocks, dragging the broader S&P 500 lower and potentially exposing the first cracks in this cycle’s speculative core.
Fed Policy – The Hawkish Overhang
Another layer of uncertainty weighing on markets is the Federal Reserve’s policy trajectory. While investors continue to anticipate eventual rate cuts, the Fed remains far from a full pivot. Inflation, though softer than in 2023, has proven stubbornly sticky, keeping policymakers cautious and liquidity conditions tight.
This cautious stance translates into slower credit growth, reduced risk appetite, and growing stress across highly valued equities. The market’s core assumption — that “the Fed will eventually cut” — may be true, but the pace and context of those cuts are what truly matter.
If the Fed proceeds with gradual, data-dependent easing, the result could disappoint markets that are still positioned for aggressive stimulus. Moreover, if those rate cuts come in response to a weaker labor market or deteriorating growth, it would reinforce — not relieve — recession concerns.
In essence, a Fed cut born out of economic weakness is not the bullish catalyst investors hope for. Instead, it signals a policy dilemma: easing into a slowdown rather than accelerating a recovery.
Technical Outlook – Cracks Beneath the Surface
From a technical standpoint, the S&P 500’s structure is beginning to show visible fatigue. Despite maintaining an upward trajectory through most of 2025, the recent pullback appears to be developing into a broader corrective phase — one that is more significant than previous dips — with selling momentum starting to expand.
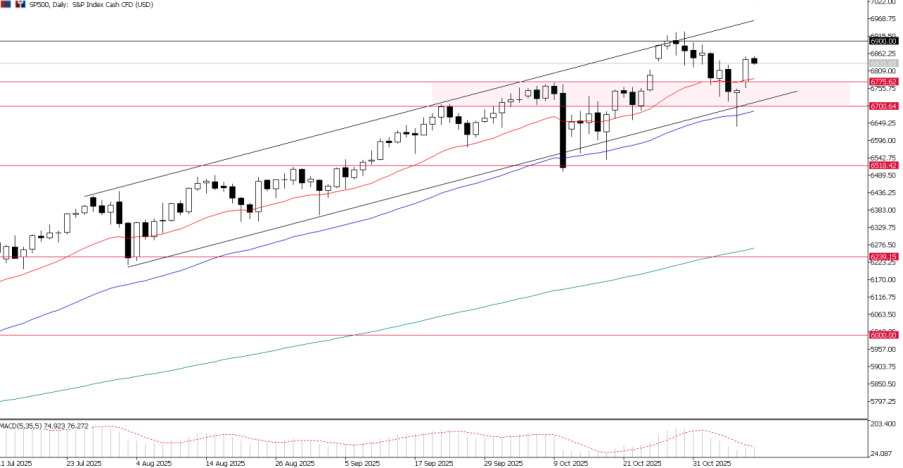
S&P500 Index, Day Chart Analysis
This shift in price behavior suggests that rallies are increasingly being sold into, while market breadth continues to narrow across sectors. Fewer stocks are contributing to the index’s gains, and leadership remains overly concentrated in a handful of mega-cap tech names — a fragile setup that often precedes deeper market corrections.
Professional Insight: Cautious Bullish — But Cracks Forming Beneath
Bias: Cautious Bullish (Corrective Phase Developing)
Entry Zone: 6,775 – 6,700 (Bearish Breakout Zone)
Support: 6,510 (Medium-Term Support)
Target: 6,250 – 6,000
The S&P 500 has yet to confirm a bearish reversal, but warning signs are accumulating. A sustained break below the 6,775–6,700 support zone and the rising channel structure would signal the start of a corrective phase. Until then, the bias remains cautiously bullish — but traders should stay alert for a momentum shift as sector breadth weakens and macro risks build.
Conclusion: S&P 500 — From Strength to Caution
The S&P 500’s remarkable resilience through 2025 masks an increasingly fragile foundation. Beneath the surface, growth headwinds, policy uncertainty, and valuation excesses are converging — setting the stage for potential correction. While the broader trend remains technically intact, the balance of risk is shifting. For investors, this is no longer the time to chase momentum, but to protect gains and prepare for volatility ahead.