Copper Rally Overstretched: Short Opportunities Emerging
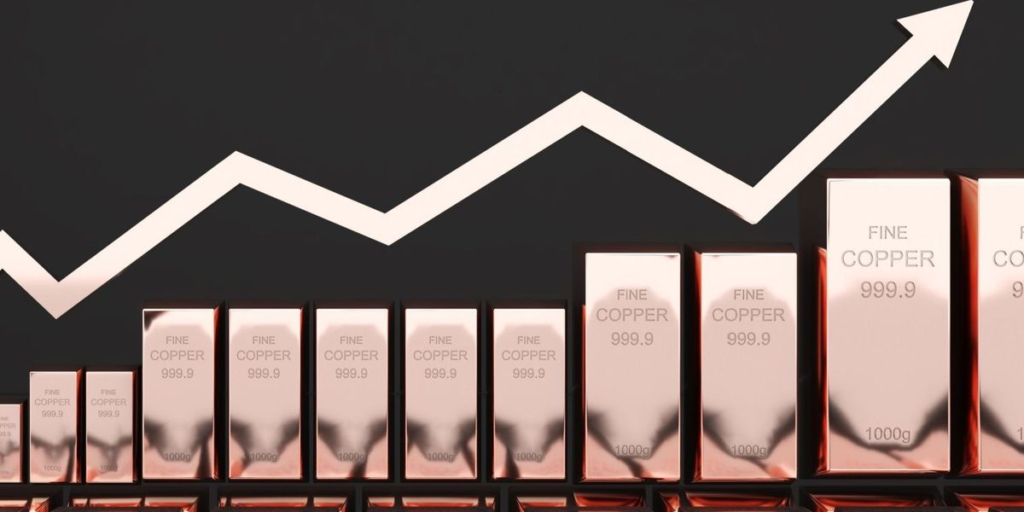
Copper prices (COMEX) rebounded toward $5.19/lb in November — staging a strong recovery after the sharp October decline. However, deeper analysis shows that this Copper rally was driven mostly by temporary, non-fundamental forces, rather than a genuine rebound in global industrial Copper demand.
As these one-off catalysts fade, the Copper market is increasingly vulnerable to a downside correction.
Table of Contents
Why Copper Surged Recently?Supply Disruptions Triggered Panic Buying
Short-term Copper supply risks—such as the Grasberg mudslide and disruptions in Chile and Panama—triggered algorithmic and momentum-based buying.
But physical demand did not improve correspondingly.
Copper Supply Disruption Overview
| Region / Event | Impact on Copper Market | Nature of Effect |
| Indonesia (Grasberg) | Short-term production concerns | Temporary |
| Chile / Panama | Ongoing operational constraints | Intermittent |
| Trader Response | Algorithmic panic buying | Non-structural |
Copper prices were lifted artificially as traders bought aggressively despite weak downstream demand.
Tariff Front-Loading Created “Fake” U.S. Copper Demand
Expectations of new tariffs led to early imports rather than real consumption growth.
This caused COMEX inventories to exceed 400,000 tonnes, a multi-year high.
U.S. Copper Market Distortion
| Category | Status (Nov–Dec) | Comment |
| Copper Imports | Surge | Driven by tariff concerns |
| COMEX Inventory | 400,000+ tonnes | Highest in years |
| Real Consumption | Flat / Weak | No increase in end-use demand |
| Market Premium | Large COMEX > LME spread | Not sustainable |
The front-loaded Copper demand will likely fade sharply in December–January as buyers digest excess stock.
Macro Optimism Gave Copper a Speculative Tailwind
- Expectations of a December Fed cut
- A weakening Dollar
- A general risk-on environment lifting all commodities
Copper benefited from macro sentiment, not from fundamentals.
AI-related electrification themes added a speculative premium, even though real industrial Copper consumption has not caught up.
Why Copper’s Rally Now Creates Bearish Risks
Much of the recent Copper demand spike was due to inventory accumulation—not actual usage.
U.S. Copper Demand Breakdown
| Driver | Contribution to Demand | Sustainability |
| Tariff-preemptive buying | High | Unsustainable |
| Real industrial usage | Weak | Neutral / Negative |
| COMEX inventory | Very high | Bearish |
| Macro sentiment | Strong influence | Volatile |
As inventory-driven demand fades, the U.S. Copper market may face an “air pocket” of reduced consumption.
China’s Demand Destruction Is the Real Red Flag
China consumes over 50% of the world’s Copper. And right now, its signals are concerning:
- Copper rod processing rates fell to ~61%, a multi-year low
- Fabricators cutting output or switching to aluminum
- Stimulus measures not translating into real construction demand
- Chinese smelters announcing 10%+ output cuts for 2026
These production cuts reflect demand weakness, not bullish tightness.
When downstream buyers refuse to pay high Copper prices, the entire supply chain weakens.
China Copper Sector Stress Indicators
| Indicator | Current Level | Interpretation |
| Rod Processing Rate | ~61% | Weak demand |
| Fabricator Output | Declining | Cost pressure |
| Metal Substitution | Increasing (Aluminum) | Price sensitivity |
| Smelter Cuts | >10% for 2026 | Downstream weakness |
Copper Technical Outlook (COMEX Future CFDs)
- Bias: Cautious Bearish
- Key Resistance: $5.20 – $5.34
- Short Entry Setup: Look for failed rallies below resistance
- Target Zone: $4.50 – $4.00
- Stop-Loss: Above $5.34 to avoid news-induced spikes
Copper’s price pattern suggests the rally is losing strength, and the downside risk is rising as fundamentals weaken.
Summary: Copper’s Rally Is Losing Fuel
Copper’s November surge was built on panic buying, inventory front-loading, and macro optimism, not real demand.
With U.S. inventories at multi-year highs, China showing significant demand fatigue, and speculative flows fading, the Copper market is increasingly exposed to a correction.
For traders:
- $5.20–$5.34 remains a key Copper resistance zone
- Fading momentum near this level offers attractive short opportunities
- The medium-term Copper outlook leans bearish unless true industrial demand returns
Copper’s fundamentals are not supporting its elevated prices — caution is warranted.

Frequently Asked Questions (FAQ)
Why did Copper prices rise so sharply in November?
Copper rallied due to short-term supply disruptions, tariff-related front-loading in the U.S., and macro-driven speculative flows — not because of stronger industrial demand.
Is Copper demand in China weakening?
Yes. Processing activity has dropped, fabricators are cutting production, and smelters announced 10%+ output cuts for 2026 — signaling severe demand pressure.
Will Copper prices correct in the coming months?
Copper is at risk of a downturn as temporary drivers fade, inventories rise, and real consumption remains weak. A correction toward $4.50–$4.00 is possible.
Is now a good time to short Copper?
Short setups become attractive if Copper fails to break resistance at $5.20–$5.34, showing clear signs of exhaustion. Traders should confirm weakness before entering.